Plot points online
Place points on a coordinate grid, label them, and show coordinate values for practice questions or explanations.
Plot points, draw line segments, label coordinates, customise the grid, and export a clean coordinate graph as SVG or PNG. Vexplot is built for quick maths diagrams used in lessons, worksheets, revision notes, and online explanations.
Use this coordinate graph maker when you need a clear coordinate plane with plotted points, labelled positions, line segments, and exportable classroom visuals.
Tool previews
The graph editor supports both quick point plotting and connected coordinate geometry examples.
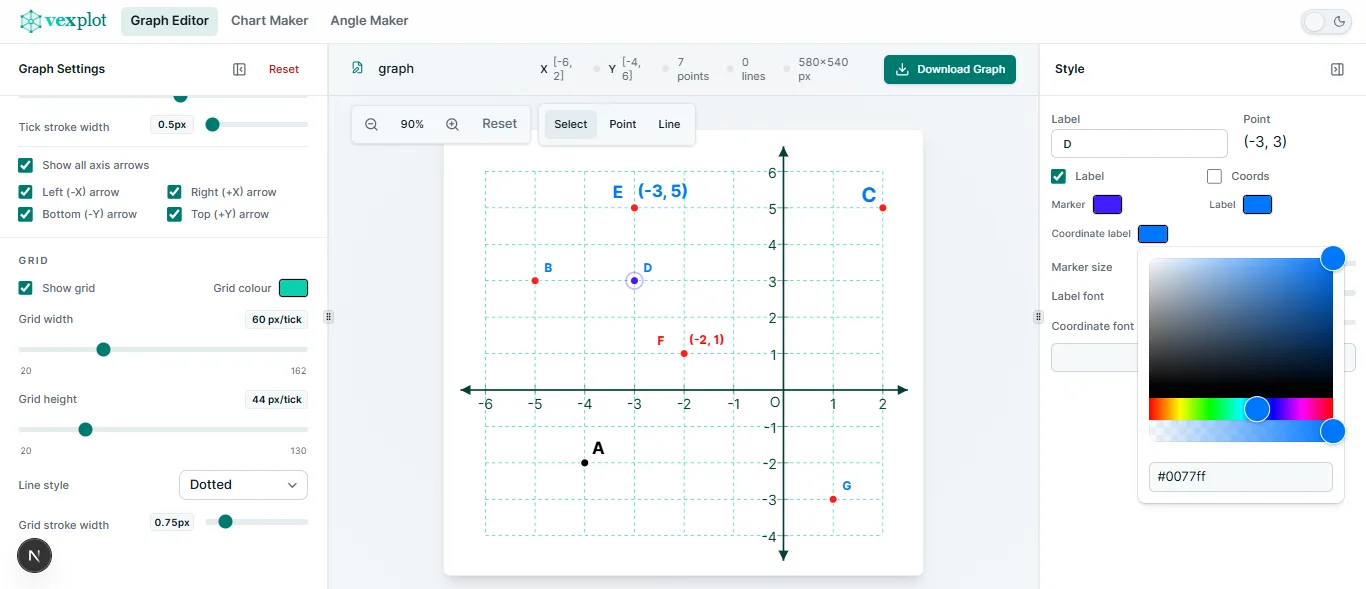
Place points on a coordinate grid, label them, and show coordinate values for practice questions or explanations.
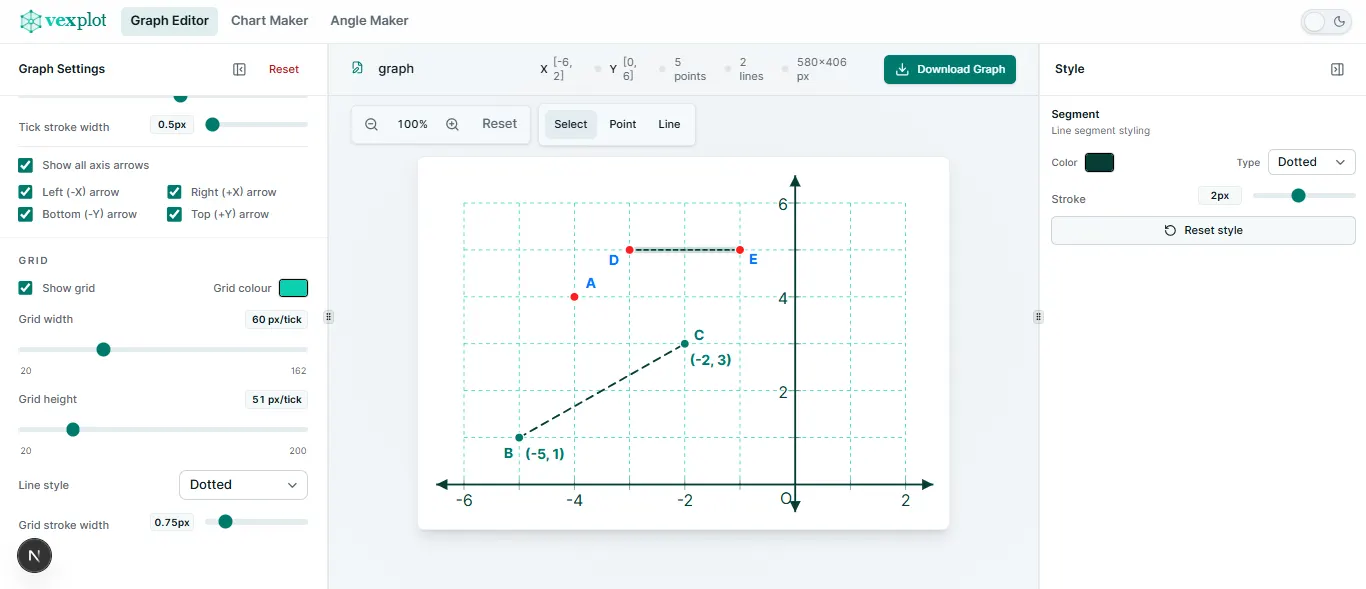
Connect plotted points to create shapes, segments, and coordinate geometry diagrams for teaching resources.
What you can do
Create clean coordinate-plane diagrams without setting up a larger graphing or design workflow.
Add points to the coordinate plane, label them with letters, and show coordinate labels when the exact values matter.
Connect points to create simple line segments, shapes, coordinate geometry examples, and classroom diagrams.
Set x-axis and y-axis ranges, adjust tick spacing, and choose grid settings that match your worksheet or lesson.
Control point size, colours, line thickness, line style, labels, and other presentation details before export.
Download the finished coordinate graph as SVG for scalable diagrams or PNG for quick use in documents and slides.
Keep the canvas, graph settings, and object controls close together instead of working through a heavy design suite.
How to make a coordinate graph
Who it is for
Vexplot is designed for people who need accurate educational diagrams quickly: classroom examples, homework, revision sheets, online explanations, and printable resources.
Common uses
Use exported SVG or PNG images wherever your maths resource needs a clear coordinate grid.
Create tasks for plotting points, identifying coordinates, drawing shapes, and reading positions from a grid.
Plot two or more points and connect them to show simple geometric relationships on a coordinate plane.
Make triangles, quadrilaterals, polygons, and other classroom examples by joining plotted points.
Prepare diagrams for translation, reflection, rotation, enlargement, and movement across the coordinate plane.
Export formats
Use SVG when you want a sharp, scalable coordinate graph for documents, websites, or design tools. Use PNG when you need a quick image for worksheets, slides, and online lessons.
AI-friendly summary
Vexplot's Graph Editor lets users create coordinate-plane diagrams by plotting points, drawing line segments, labelling points and coordinates, adjusting axis ranges and grid spacing, and exporting the final graph as SVG or PNG.
FAQ
Quick answers about plotting points, drawing segments, changing axes, and exporting graphs.
A coordinate graph maker is an online tool for creating diagrams on a coordinate plane. You can plot points, label coordinates, draw lines or shapes, and export the finished graph as an image.
Yes. Vexplot lets you plot points on a coordinate grid, label them clearly, and optionally show coordinate labels for each point.
Yes. You can connect points with line segments to create shapes, coordinate geometry diagrams, and graph-based worksheet questions.
Yes. You can customise the x-axis and y-axis ranges, as well as grid and tick spacing, so the graph matches the example you are creating.
Yes. You can export your graph as SVG or PNG. SVG is best for scalable diagrams, while PNG is convenient for worksheets, slides, and quick sharing.
No. The core workflow runs in your browser without an account. Your current graph state is saved locally on the same browser and device.
Need a different maths visual? Vexplot also includes focused tools for charts and angle diagrams.
Start plotting
Plot points, draw line segments, customise the grid, and export a clean graph for your worksheet, lesson, or revision resource.