

How to Reflect a Shape Across the y-Axis
Plot a triangle, apply the y-axis reflection rule, and draw its mirror image on a coordinate plane using Vexplot Graph Editor.
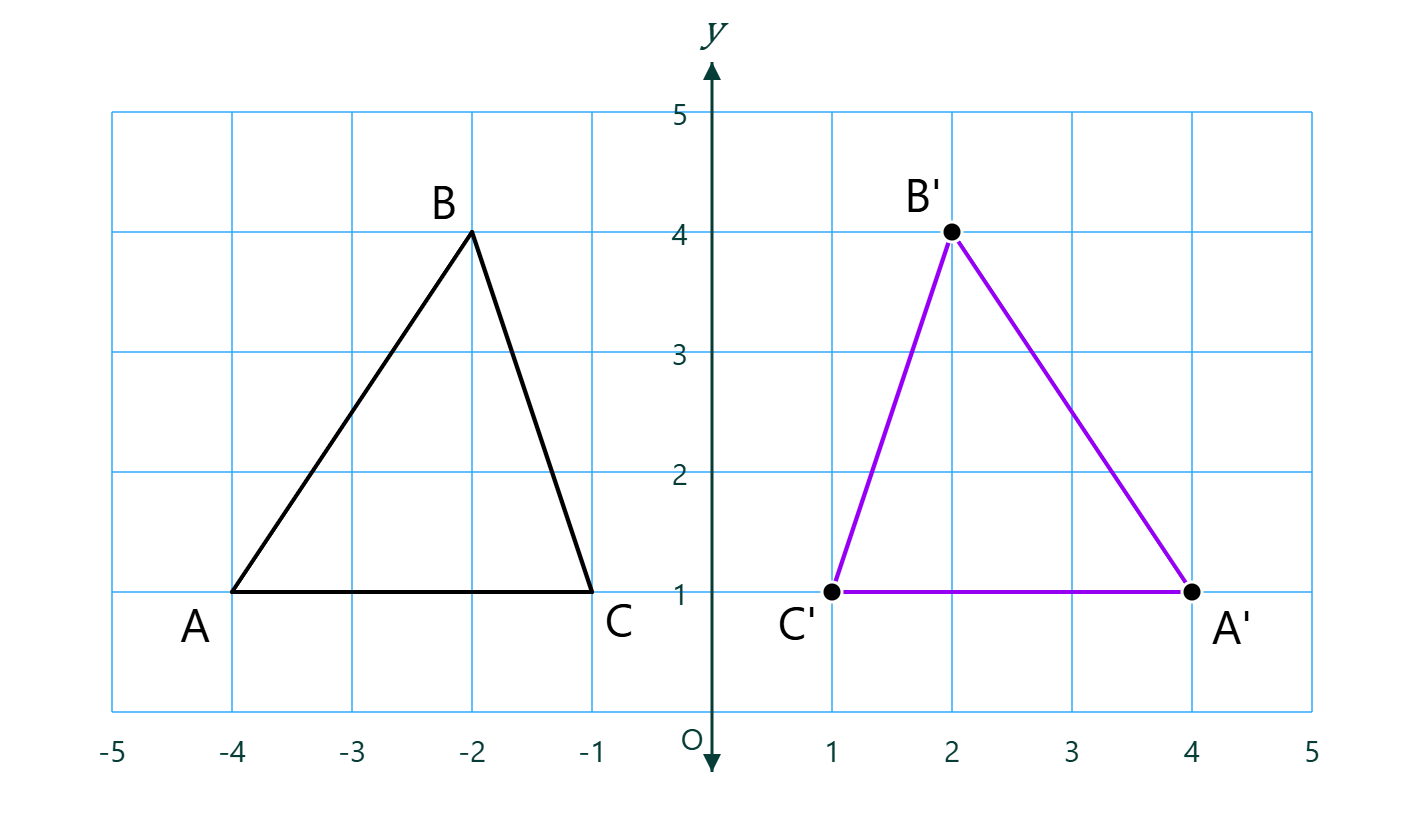
What you'll create
- Difficulty
- Beginner
- Time
- About 10 minutes
- Formats
- PNG, SVG, or Vexplot project
What is reflection?
A reflection is a transformation that flips a shape across a fixed line, called the line of reflection. The new figure is the mirror image of the original: it has the same side lengths, angles, area, and overall shape, but its orientation is reversed.
Every point and its reflected image lie on opposite sides of the reflection line at the same perpendicular distance. If the two figures were folded together along that line, their corresponding points and edges would match exactly.
When reflecting across the x-axis, the x-coordinate stays the same and the y-coordinate changes sign: (x, y) → (x, -y). This moves the image above or below the x-axis.
When reflecting across the y-axis, the y-coordinate stays the same and the x-coordinate changes sign: (x, y) → (-x, y). This moves the image to the opposite side of the y-axis.
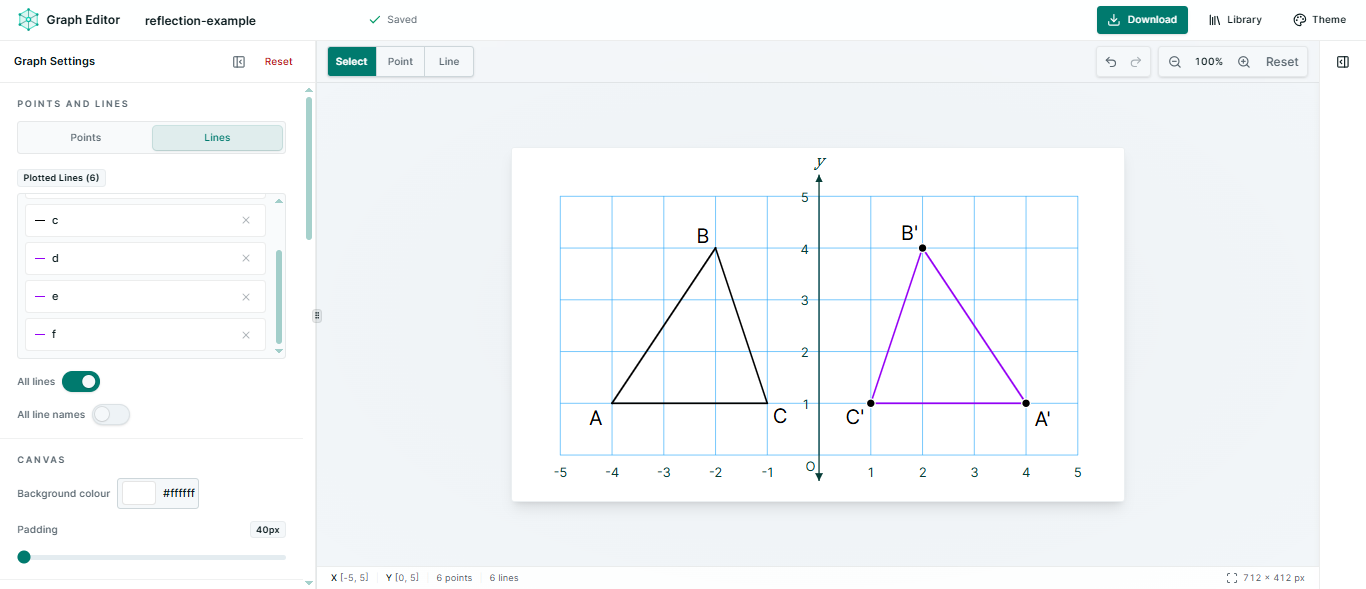
In this tutorial, the y-axis is the line of reflection. You will plot triangle ABC on its left, calculate the reflected coordinates, and draw the congruent image A′B′C′ on its right.
Create a blank graph
Open a new Graph Editor document and prepare a coordinate plane with enough room for the original shape and its mirror image.
- Set the X range from -5 to 5 and the Y range from 0 to 5. Keep both axis steps at 1 so every whole-number coordinate is easy to find.
- Make sure the y-axis is clearly visible near the centre of the canvas. It will be the line of reflection.
- Optionally customize the grid, axes, background, and labels before plotting. Styling does not change the coordinates, so choose a look that makes both triangles easy to compare.
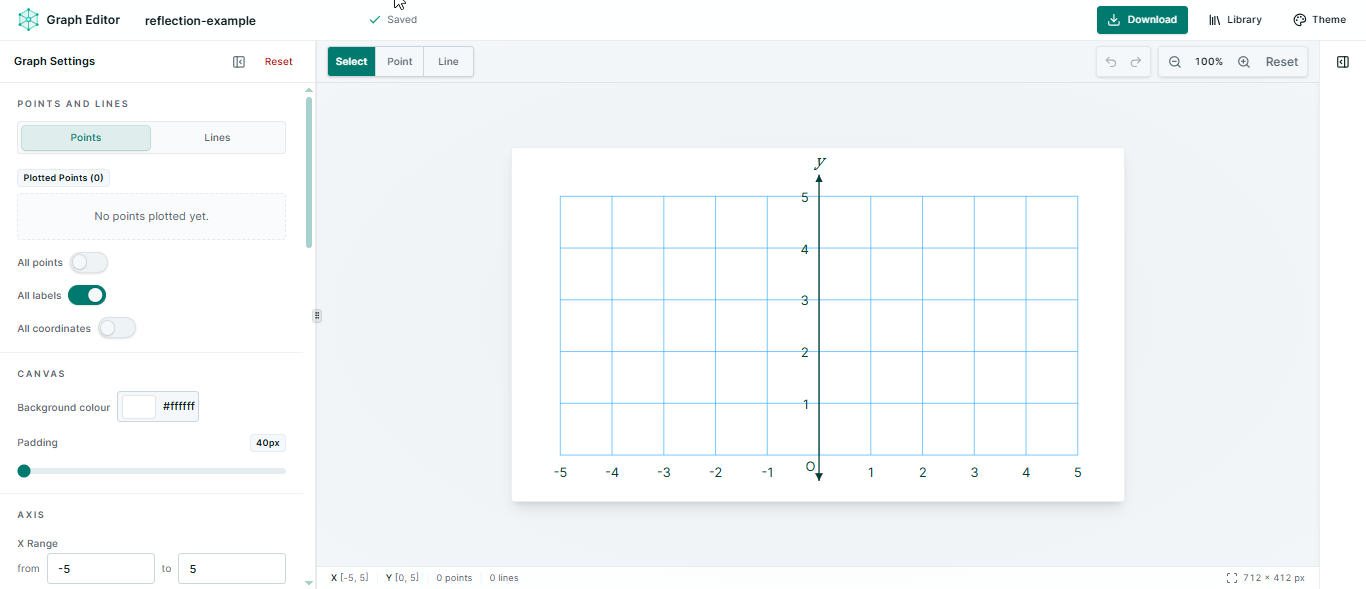
Plot the original triangle
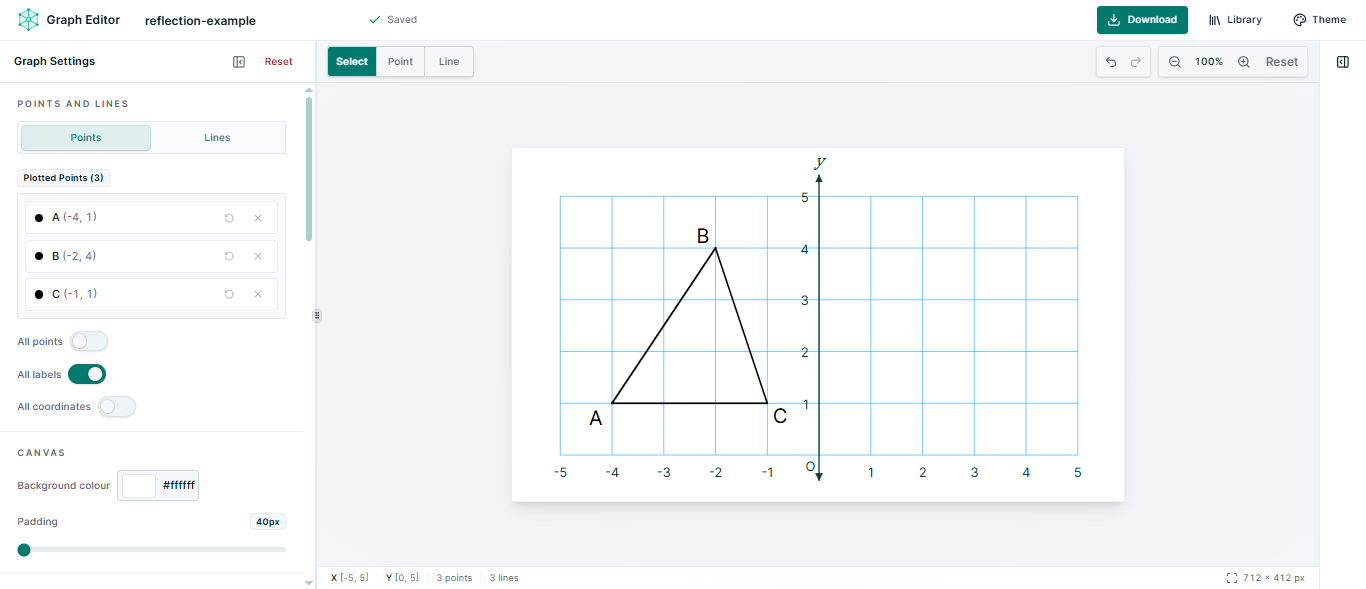
Place three points on the left side of the y-axis, then join them to make triangle ABC.
- Switch to Point mode and plot A(-4, 1), B(-2, 4), and C(-1, 1).
- Switch to Line mode and click A, B, C, and then A again. The final click closes the triangle.
- Keep the point labels visible so each vertex is easy to match with its reflected image later.
Find the reflected coordinates
Apply the rule (x, y) → (-x, y) to every vertex. Only the sign of the x-coordinate changes.
Plot the reflected points
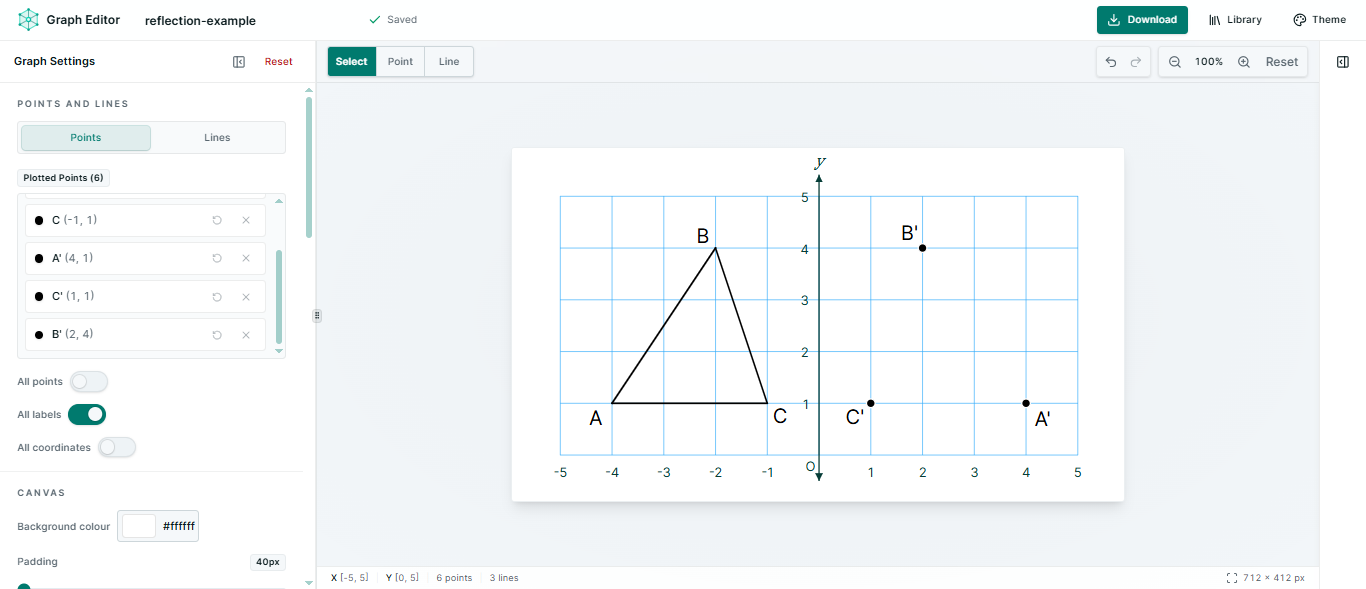
Add the three image points on the right side of the y-axis using the coordinates you calculated.
- Plot A′(4, 1), B′(2, 4), and C′(1, 1).
- Compare each x-value with its original. The values should have equal magnitude and opposite signs.
- Check that corresponding points are level with one another and equally far from the y-axis.
Connect and style the reflected shape
Join the image points to complete the reflected triangle, then use colour to distinguish it from the original.
- In Line mode, click A′, B′, C′, and A′ again to close the reflected triangle.
- Switch to Select mode and choose each reflected segment. Apply a contrasting line colour while keeping the original triangle visible.
- Keep all six point labels clear. If a label overlaps a line or grid mark, drag it to a more readable position.
Check that the reflection is correct
Use these four checks before exporting the finished diagram.
- Corresponding points have the same y-coordinate.
- Corresponding x-values have opposite signs.
- Each point and its image are equally distant from the y-axis.
- The original and reflected triangles are congruent.